![]()
"Fractal geometry reveals that some of the most austerely formal chapters
of mathematics had a hidden face: a
world of beauty unsuspected until now."
Benoit
Mandelbrot, The Fractal Geometry of Nature, 1982.
| Mandelbrot Set | Using
MandelMovie | Julia Set | Exploring
Julia Set & MandelMovie |
In 1980, Benoit Mandelbrot [1] (1924 - ) used a computer to plot a set of non-linear fractals, exhibiting a complexity never before seen in pictures of mathematical objects. Today these coarse black and white images might be considered primitive, but Mandelbrot recalls that his first illustrations 'lit [his] life with intellectual and aesthetic revelations.' Mandelbrot had demonstrated the beauty of non-linear fractals. His pictures of dazzling shapes generated new interest in a field of mathematics which had lain dormant since it was first introduced by two French mathematicians Gaston Julia(1893-1978) and Pierre Fatou (1878-1929) in the early part of the 20th century.
![]() ). That's why we call them non-linear fractals.
). That's why we call them non-linear fractals.
The Mandelbrot Set (top)
"The stunning beauty of the images it generates means that its appeal is both emotional and universal. ... [It]-quite literally-[has] infinite ramifications."
- Edith and Donald Craig [2] ,The Psychodynamics of the M-set

Figure 5.2 Full Mandelbrot Set.
The Mandelbrot set, along with other non-linear fractals, exhibits shapes that when examined at greater magnification seem to be forever changing, while still retaining a structure uniquely defined to its equation. These variations found in non-linear fractals make them some of the most intriguing objects in contemporary mathematics [3] . For instance the overall shape of the Mandelbrot set looks like a beetle, but if you look closely, you will notice other shapes. Look at the boarder of the Mandelbrot set in Figure 5.3 and Color Plates 27 - 31. Can you see shapes that resemble lightening, sea horses, and other intriguing shapes?

Figure 5.3 Peering deeper into the Mandelbrot set.
In Chapter 3, we discussed how you can determine the similarity of two shapes by comparing their regions at different levels of magnifications. Look at regions in Figure 5.4. Notice that they have a close resemblance to the original Mandelbrot set. Now compare regions shown in Figure 5.3 with the original set. Notice that these regions bear only a slight resemblance to the original set, we say these regions have a greater variance to the original shape.
It should be noted that all regions contained in the Mandelbrot set are
connected to each other, in some places these connections may be a finally
connected path with only a width of a single point, as seen in sections
of Figure 5.5 and Color plate 32. Through these connected paths we see that
each region is only a subset of the complete set.

Figure 5.4 Self-similar structures of the Mandelbrot set.

Figure 5.5 Finely Defined Connection Path.
Generating Mandelbrot Set Through Iterations.
The Mandelbrot Set is calculated by a process called iteration. In using an iteration function we put an initial value into an equation and then an operation is carried out on it generating a new value. This new value in turn is then put back into the equation generating yet another new value. This process can be continued indefinitely, usually being calculated until some desired result is derived such as the particular value is shown to converge to a certain point or it is shown to continually grow eventually escaping to infinity. See Chapter 7 for algorithms of iterations functions and Appendix G for an iteration experiment you can do using video feedback.

Figure 5.6 Iteration Function for the Mandelbrot Set [4] .
The Mandelbrot set is generated by using the iteration function
![]() for values of
for values of
![]() . In this function, we start with
an initial value
. In this function, we start with
an initial value
![]() . Then the value
. Then the value
![]() is squared and added to a constant
is squared and added to a constant
![]() . Here
. Here
![]() is the position of the initial point
being calculated. This operation results in a new value
is the position of the initial point
being calculated. This operation results in a new value
![]() . We can repeat this process--in which another new value is derived from
the previous one--as often as we like.
. We can repeat this process--in which another new value is derived from
the previous one--as often as we like.
Calculating Boundary Values for the Mandelbrot
Set
The Mandelbrot set is made up of all points for which the iterated function
![]() does not produce values that grow
to infinity. This area is referred to as the contained or the bounded region.
Points outside this region are referred to as escaping.
does not produce values that grow
to infinity. This area is referred to as the contained or the bounded region.
Points outside this region are referred to as escaping.

Figure 5.7 Real line segment with boundary limits.
To see how boundary values are calculated we will first look at points on a line:
• First take the line values
from
![]() to
to
![]() .
.
• Next take any value on
this line and square it so that
![]() . This new value will
remain in the original range.
. This new value will
remain in the original range.
• If you continue to square
the results, you will notice that for
![]() and
and
![]() the value will become
the value will become
![]() and all the other contained values
will approach
and all the other contained values
will approach
![]() . Examples of containment are:
. Examples of containment are:
![]()
![]()
![]() ... ,
... ,
![]()
![]()
![]()
![]() ... .
... .
• If you take values outside
the range between
![]() and
and
![]() , the values will increase to infinity.
These are the escaping values. The larger the initial value, in terms of
its absolute value, the greater the speed of increase. Areas that go off
to infinity are called the unbounded region. The rate of increase is often
assigned a corresponding color. So lets say points that reach values greater
then 100 after 3 iteration cycles would be one color and points that reach
it in 4 iteration cycles would be another with each progressive level having
a change in color. Examples of rates
of increase are:
, the values will increase to infinity.
These are the escaping values. The larger the initial value, in terms of
its absolute value, the greater the speed of increase. Areas that go off
to infinity are called the unbounded region. The rate of increase is often
assigned a corresponding color. So lets say points that reach values greater
then 100 after 3 iteration cycles would be one color and points that reach
it in 4 iteration cycles would be another with each progressive level having
a change in color. Examples of rates
of increase are:
![]()
![]()
![]()
![]()
![]() ... ,
... ,
![]()
![]()
![]() ... .
... .
Now lets look at a small section of the Mandelbrot, the part that deals with real values.

Figure 5.8 Section of the Mandelbrot set that deals real numbers, the x-axis.
To apply the Mandelbrot equation
![]() to this region:
to this region:
• Start with an initial
value
![]() and coordinate constant
and coordinate constant
![]() on the x-axis.
on the x-axis.
• Next square
![]() and add the appropriate constant.
This will give a new value for
and add the appropriate constant.
This will give a new value for
![]() .
.
• Now put this new value
into the equation, square it and add the same constant. Carry out this procedure
until you can determine if the point value is in the set, the contained
region near the origin
![]() (usually colored black ) or if the
point is not contained and therefore goes off to infinity. For the escaping
points you can assigned colors to correspond to speeds in which they head
off to infinity.
(usually colored black ) or if the
point is not contained and therefore goes off to infinity. For the escaping
points you can assigned colors to correspond to speeds in which they head
off to infinity.
Series for
![]() , carried out for different values of
, carried out for different values of
![]() .
.
![]()
![]() ... contained constant.
... contained constant.
![]()
![]() contained and periodic.
contained and periodic.
![]()
![]() contained approaching
contained approaching
![]() .
.
![]()
![]() ... not contained, escapes to
infinity.
... not contained, escapes to
infinity.
You may want to calculate the range of the contained regions for the real numbers of the Mandelbrot.
Answer:
![]() is contained from
is contained from
![]() to
to
![]() .
.
Identities of Complex Numbers
Imaginary numbers play a crucial roll in fractal geometry. They are used to generate values of many types of non-linear fractals including the Mandelbrot set.
Complex numbers [5] contain values with negative square roots. Since they have no real solutions, their numbers are often referred to as imaginary.
Complex numbers are expressed by :
![]() =
=
![]() or
or
![]() =
=
![]() .
.

Figure 5.9 Graph of the complex plane.
We will write complex numbers in their algebraic form of
![]() , where
, where
![]() denotes the real part and
denotes the real part and
![]() the imaginary part. A standard way to represent this is on a graph, where
the
the imaginary part. A standard way to represent this is on a graph, where
the
![]() -axis represents the real parts and the
-axis represents the real parts and the
![]() -axis represents the imaginary parts see Figure 5.10.
-axis represents the imaginary parts see Figure 5.10.
Here are some forms in which operations of complex numbers are expressed:
![]() .
.
![]()
factored
to
![]() .
.
Figure 5.10 Properties of addition and multiplication of imaginary numbers.
Notice that in both cases the real and the imaginary parts remain separated.
Here are forms derived from complex numbers:
•
![]() is the radius of a complex number.
is the radius of a complex number.
•
![]() is the absolute value of
is the absolute value of
![]() .
.
Figure 5.11 Calculated values of radius and absolute values derived from
complex numbers.
Bounded Values for the Mandelbrot Set over the Complex Plane.
If we choose a point
![]() and it is contained in the Mandelbrot
set, one of the following things will happen as its iteration cycles are
carried out:
and it is contained in the Mandelbrot
set, one of the following things will happen as its iteration cycles are
carried out:
• We might obtain a sequence of values tending to a finite limit, that is converge to a single point.
• We might get a sequence which tends toward a cycle; for instance, the even terms of the sequence could tend to one point and the odd terms to another.
• The sequence might bounce around with apparent randomness forever in the contained region.
In all of these cases, we say that
![]() fails
to escape from the general area of the origin
fails
to escape from the general area of the origin
![]() . These points
. These points
![]() found to be contained are the region known as
the Mandelbrot set. It should be noted that the distance of a point contained
in the Mandelbrot set will never exceed the value
found to be contained are the region known as
the Mandelbrot set. It should be noted that the distance of a point contained
in the Mandelbrot set will never exceed the value
![]() . For all points outside this radius will tend
toward infinity.
. For all points outside this radius will tend
toward infinity.

Figure 5.12 Three types of contained points in the Mandelbrot set: converging,
oscillating and cyclic.
Escaping values for the Mandelbrot
set.
All
points that are not contained
[6]
in the Mandelbrot set will escape to infinity. In some
instances a point might seem contained then suddenly the sequence starts
growing rapidly, in other cases the point will immediately exceed its boundary
with
![]() becoming so large that adding
becoming so large that adding
![]() hardly affects the value of
hardly affects the value of
![]() . For each case once
. For each case once
![]() , the radius value, exceeds
, the radius value, exceeds
![]() , there is no looking back. So we will say that a point
, there is no looking back. So we will say that a point
![]() escapes in
escapes in
![]() turns if after
turns if after
![]() iterations
iterations
![]() first exceeds
first exceeds
![]() . These areas are the beautiful colored regions you see outside the
Mandelbrot set. It is common to assign colors
[7]
corresponding to the number of iterations needed for
the radius value
. These areas are the beautiful colored regions you see outside the
Mandelbrot set. It is common to assign colors
[7]
corresponding to the number of iterations needed for
the radius value
![]() to exceed
to exceed
![]() . Any value greater than
. Any value greater than
![]() can also be chosen.
can also be chosen.
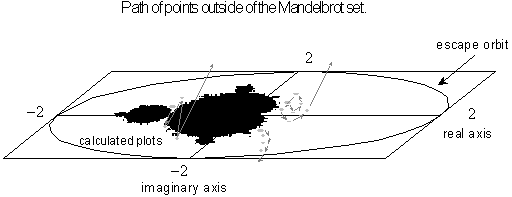
Figure 5.13 Points that escape to infinity, found outside the Mandelbrot
set.
Calculating the Mandelbrot Set with
Complex Numbers.
Lets calculate a point’s iteration values through four cycles.
• First lets expand the
Mandelbrot set equation,
![]() , using the form
, using the form
![]() so that
so that
![]() .
.
• Next we start by letting
![]() and choosing an arbitrarily value
and choosing an arbitrarily value
![]() as our point on the plane.
as our point on the plane.
• Now by placing the initial values into the equation and carry out the iteration process four times we get the following results:
![]()
![]()
![]()
![]()
![]()
Now since the radius
![]() which is greater than
which is greater than
![]() we know that point
we know that point
![]() will escape and therefore lies outside
the Mandelbrot set, see Figure 5.11 showing its escaping orbit.
will escape and therefore lies outside
the Mandelbrot set, see Figure 5.11 showing its escaping orbit.
Exploring Orbits of the Mandelbrot
Set

Figure 5.14 Regions of the Mandelbrot set with Different Orbit Values.
When a point’s location is iterated, a value is calculated which corresponds to a new location. The path that the point follows is referred to as its orbit. Points within the Mandelbrot set have varying periodic orbits, each corresponding to a specific region in which it is found. In the main cardioid, the heart shaped region of the Mandelbrot set, you will find points with a single basin of attraction. In the next region proceeding left orbits will have period 2. Adjacent regions have even greater periods. As you can see in Figure 5.14, orbit values for different regions vary widely. Examining boarder regions with large orbit values often produces interesting shapes exhibiting a large corresponding symmetry see Figure 5.15. Points found outside the Mandelbrot set have orbit paths that continue to grow at ever increasing rates toward infinity see Figure 5.12 and Figure 5.13 for orbit paths.

Figure 5.15 An example of a large symmetric orbit
[8]
![]() .
.
Here we will simulate how orbits travel by following the paths generated from box grid values.
 The
Orbit Game
In the orbit game the object is to find out which boxes belong together. In each box there is a coordinate value that sends you to another box. This simulates the process a point goes through when it is iterated. Eventually you either find a square that is mapped to itself, the basin of attraction or you find a path that keeps repeating itself, this is its orbit.
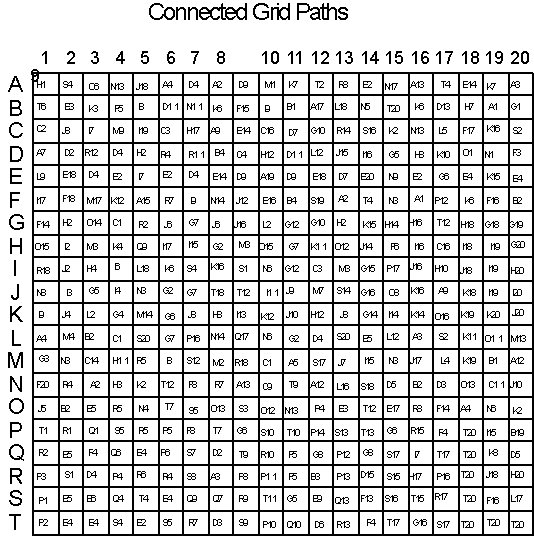
Figure 5.16 The Orbit Grid used to define different paths.
To begin the orbit path game:
Step 1: First make a copy of the orbit grid and get different color markers.
Step 2: Choose an square that has not been chosen before and place a dot in it with your pencil.
Step 3: Proceed to the square indicated in the square you have chosen and put a pencil dot in it. Continue this procedure until you come to a square with a pencil mark already in it. If it has not been colored, chose a unique color and color all boxes of the path with the same color. If it has been previously colored, color all the path’s marked squares with that color.
Step 4: Continue by starting the procedure again with Step 2, until all the square have been colorized.
Now lets use the program MandelMovie to peer deeper into the world of fractals. This is one of the programs you will find included in the book's accompanying Macintosh disk.
 Using MandelMovie™ to Explore the Mandelbrot Set (top)
MandelMovie is a Macintosh program that allows you to explore with the intricacies of the Mandelbrot set and the associated Julia sets. MandelMovie automatically draws the Mandelbrot set. You use controls to move around the plane, zooming in and out to examine the details of the set's structure.
Starting MandelMovie
Copy the program onto your computer's hard drive. If you only have a floppy drive, make one back-up and use it directly.

Figure 5.17 MandelMovie folder.
Open the MandelMovie folder. Then open the MandelMovie program by double clicking on its icon.

Figure 5.18 MandelMovie program icon.
Your screen should look like this.
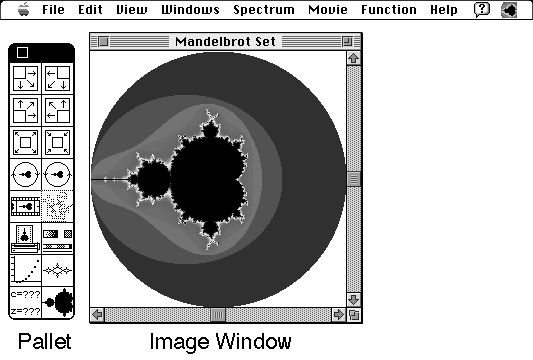
Figure 5.19 MandelMovie open with menu, tool pallet and image window.
The tool pallet is on the left and a window containing the overall Mandelbrot set is in the center. On top, there is a full set of menu commands.
Starting a New Mandelbrot Set
If you ever wish to start a new Mandelbrot set, just select "New" from the "File" menu or click the Mandelbrot picture in the lower-right corner of the tool pallet. To close a window in MandelMovie chose "Close" form the "File" menu or click the little close box in its top-left corner . If you do not wish to retain the image for future use hold down the shift key while clicking on the close box.
Ending the Program
To end the program chose "Quit" from the "File" menu the computer will ask you if you want to save any of your pictures.
Exploring the Mandelbrot set
When Mandelbrot first plotted his set, he found many "specks" on the print out. Initially, it was unclear what they were as seen Figure 5.1.
With MandelMovie, you can explore these specks to see what they are.
Step 1: Open a "New" window from either the "File" menu or pallet.
Step 2: Search for fine black specks. Choose one that you would like to explore.
Step 3: Zoom in by moving the mouse cursor over the top-left corner of your speck. Holding down the mouse button, drag the cursor to the bottom-right of the speck. Let go, and you'll see your speck magnified in an enlarged window.
Step 4: You can repeat this procedure as often as you like. You will find many other interesting specks as you continue your search. Two good places to find miniature Mandelbrot sets are along the real axis in the negative direction and the outer reaches of the set which often resemble lightning strands.
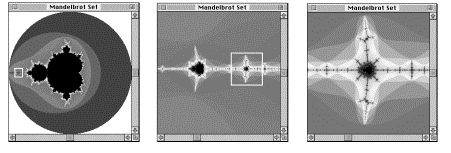
Figure 5.20 Finding Mandelbrot sets at three levels of magnification.
Monitoring Drawing Time

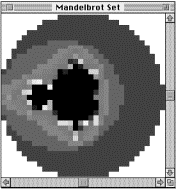
Because the program uses a course-to-fine method to generate pictures, sometimes you will have to wait a short time
for a high resolution version to appear, especially as you travel deeper,
to where images must be calculated with greater precision. To monitor progress
in calculations select "Status" from the "Windows" menu
in MandelMovie. It also gives a detailed account of locations and type of
picture being drawn.
Figure 5.21 Different stages of refinement of in MandelMovie's calculation of the Mandelbrot set.

Figure 5.22 Status window.
Exploring Orbits Using MandelMovie
In MandelMovie you, can use the orbit feature to show how certain points are contained or escape. One can also show points of attraction for periodic orbits of points contained in both the Mandelbrot set and Julia sets.
To use the orbit feature, select "Orbits" from the "Windows" menu. Then by placing the cursor over various sections of the different sets the orbit paths will be shown.
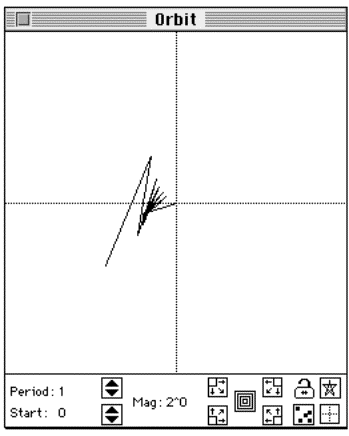
Figure 5.23 The orbit window found in MandelMovie.
Each point on the Mandelbrot set corresponds to a fractal called a Julia set derived from that point. This fact demonstrates that the Mandelbrot set is the index of all Julia sets with each point on the Mandelbrot set corresponding to a individual Julia set.
In the next section we will explore Julia sets in greater detail.
Julia Sets.
" You obtain an incredible variety of Julia sets: some are a fatty cloud, others are a skinny bush of brambles, some look like the sparks which float in the air after fireworks has gone off. One has a shape of a rabbit, lots of them have sea-horse tails."
Adrien Douady on describing Julia sets.

Figure 5.24 First illustration of Julia set, drawn in 1924 by Hubert Cremer
[9]
.
Gaston Julia [10] was a French mathematician credited with discoveries in iteration methods. In 1919, he published Memoire sur l'itération des fonctions rationelles [11] , a 199 page paper, in which he outlines constructions using iterative conformal transformation--a transformation in which angles remain constant, distorting their appearance. His paper received critical acclaim, including an award by the French Academy, but his paper did not contain pictures of the shapes he described and was soon to be forgotten. It is this transformation we use in creating Julia sets.
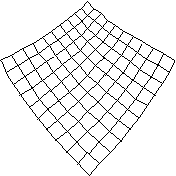
Figure 5.25 Example checkered board with conformal transformation.
Another French mathematician Pierre Fatou also did work with complex iterations. This contemporary of Julia, published many papers on the subject, resulting in a friendly rivalry of ideas. When a the elements of the Julia set are not connected as can be seen in B. and C. of Figure 5.30, the set is sometimes referred to as Fatou "dust". These disconnected pieces are similar in form to Cantor "dust" (discussed in Chapter 3).
The work of Julia and Fatou is considered extraordinary because they didn't
have computers to render their images. They relied on their imaginations
and crude hand drawings.
Julia sets are among the earliest and most intensively studied of non-linear fractals. Their beauty and variety is breathtaking. Here are a few examples:

Figure 5.26 Three examples of Julia sets showing structural beauty.
Also see Color Plates 33 -38.
Calculating Julia Sets
Julia sets are fractal structures that closely resemble the Mandelbrot set.
In fact, we use the same iteration equation
![]() , where
, where
![]() .
[12]
. What differs
is the way we calculate the values which are mapped onto the complex plane.
.
[12]
. What differs
is the way we calculate the values which are mapped onto the complex plane.

Figure 5.27 Iteration function calculation and plot of the Julia set
![]() .
.
In
constructing Julia sets, each starting point corresponds to an initial value
![]() and only one particular value for
and only one particular value for
![]() . Thus, each individual Julia set corresponds to a distinct
. Thus, each individual Julia set corresponds to a distinct
![]() that remains constant over the entire mapping.
that remains constant over the entire mapping.
Remember:
with the Mandelbrot set,
![]() is set to
is set to
![]() and each value for
and each value for
![]() corresponds to the particular point being calculated.
corresponds to the particular point being calculated.
Bounded values for Julia sets
Lets chose look at different points for the Julia set at
![]() , where
, where
![]() corresponds to a value found in
the Mandelbrot set. If you carry out the iteration indefinitely, one of
the following things will happen:
corresponds to a value found in
the Mandelbrot set. If you carry out the iteration indefinitely, one of
the following things will happen:
• We might find a sequence of values tending to a finite limit.
• We might get a sequence which tends toward a cycle of points.
• The sequence might bounce around, apparently randomly, forever, the outer boarder is a prime example.
In all of these cases, we say that
![]() fails
to escape (from the general
area of the origin.) The contained
radius of a Julia sets has a distance from the origin that never exceeds
fails
to escape (from the general
area of the origin.) The contained
radius of a Julia sets has a distance from the origin that never exceeds
![]() .
.
Escaping values for the Julia. set.
If the sequence eventually goes to infinity,
we say that
![]() escapes. Once
escapes. Once
![]() exceeds
exceeds
![]() , its value goes to infinity and we say that region is unbounded.
When coloring regions outside the Julia set, you can as in the case of the
Mandelbrot set assign colors corresponding to the number of iterations needed
for the radius
, its value goes to infinity and we say that region is unbounded.
When coloring regions outside the Julia set, you can as in the case of the
Mandelbrot set assign colors corresponding to the number of iterations needed
for the radius
![]() to exceed
to exceed
![]() or any greater value.
or any greater value.
Calculating Boundary Values for the
Julia Set
The basic equation for the Julia set is:
![]() . If
. If
![]() is set to
is set to
![]() , our equation becomes
, our equation becomes
![]() .
.
Lets look at the special case where
![]() , which forms a circle. By looking at this familiar Euclidean shape, we
can see how non-Euclidean Julia sets are formed.
, which forms a circle. By looking at this familiar Euclidean shape, we
can see how non-Euclidean Julia sets are formed.
Lets look at values calculated with complex iterations.
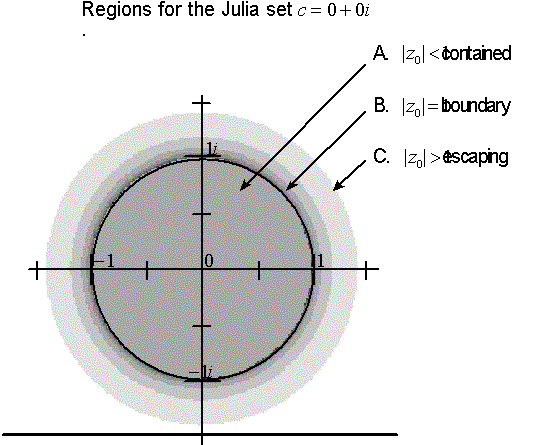
Figure 5.28 Orbits for
![]() : A. attraction to the center
: A. attraction to the center
![]() , B. iterations bound to the unit circle, where
, B. iterations bound to the unit circle, where
![]() , and C points escaping off to infinity where
, and C points escaping off to infinity where
![]() .
.
• If
![]() has a radius value where
has a radius value where
![]() , then all these iteration points will be attracted to the origin
, then all these iteration points will be attracted to the origin
![]() .
.
• If the point
![]() has a radius value
has a radius value
![]() , it lies on the boundary of the unit circle. When these points are squared,
that is our iteration function is applied, the points new mapping will also
be on the outer edge. These points form the boundary of the Julia set. This
region where every point on this outer boundary is mapped to another point
on the outer boundary we call invariant
under iteration.
, it lies on the boundary of the unit circle. When these points are squared,
that is our iteration function is applied, the points new mapping will also
be on the outer edge. These points form the boundary of the Julia set. This
region where every point on this outer boundary is mapped to another point
on the outer boundary we call invariant
under iteration.
• The points not inside
the circle
![]() are unbounded. They will escape
to infinity and are considered outside the basins of attractions.
are unbounded. They will escape
to infinity and are considered outside the basins of attractions.
Let's look at the radius for which all
![]() will escape the Julia set for a
given
will escape the Julia set for a
given
![]() . We have all ready looked at
. We have all ready looked at
![]() the minimum orbit with radius
the minimum orbit with radius
![]() . Now lets look at the maximum radius
of escape for a point found in the Mandelbrot set, the coordinate
. Now lets look at the maximum radius
of escape for a point found in the Mandelbrot set, the coordinate
![]() see Figure 5.29. This point's Julia
set has a maximum escape radius
see Figure 5.29. This point's Julia
set has a maximum escape radius
![]() . Therefore any other
. Therefore any other
![]() value whose point lies outside a
radius value of
value whose point lies outside a
radius value of
![]() form the origin, will also escape. We can approximate the bounding radius for a Julia set
form the origin, will also escape. We can approximate the bounding radius for a Julia set
![]() by
by
![]() .
.

Figure 5.29 Julia set
![]() with the maximum contained radius
with the maximum contained radius
![]() , a narrow straight line from
, a narrow straight line from
![]() to
to
![]() and its different colored escape regions.
and its different colored escape regions.
Now lets look at other Julia sets, ones with a fractal structure.
Relationship Between Julia Sets and
the Mandelbrot Set
The relationship between the Mandelbrot set and the Julia sets is as follows:
• For every point
![]() in the complex plane there exists a Julia set.
in the complex plane there exists a Julia set.
• If the point
![]() is contained in the Mandelbrot set,
all the points that make up Julia set will be connected (like examples A
and E above).
is contained in the Mandelbrot set,
all the points that make up Julia set will be connected (like examples A
and E above).
• If the point lies outside the Mandelbrot set, it will break up into an infinite set of pieces (like examples C and D below) . These Julia sets will form non-connected "dust" like particles.
• If the point is near the boundary (as in B and F), it can be very difficult to determine whether the Julia set is connected or not.

Figure 5.30 Sets made from
![]() inside and outside the Mandelbrot
set.
inside and outside the Mandelbrot
set.

Periodic Orbits of Julia Sets
As
seen with the Mandelbrot set, Julia sets also have varying periodic orbits.
The period of the Julia set's orbit is the same as
![]() 's position in the Mandelbrot set.
's position in the Mandelbrot set.

Figure 5.31 Number of basins of attractions for Julia sets, based on the
their value of
![]() in the Mandelbrot set.
in the Mandelbrot set.
Similar Looking Regions in the Mandelbrot
set and the Julia set.
For many given
![]() , the Mandelbrot set and the Julia set will exhibit a similar image when
the same region is magnified. One way to explore this is magnify a small
Mandelbrot set and create its corresponding Julia set as seen in Figure
5.32.
, the Mandelbrot set and the Julia set will exhibit a similar image when
the same region is magnified. One way to explore this is magnify a small
Mandelbrot set and create its corresponding Julia set as seen in Figure
5.32.

Figure 5.32 Similar looking regions for the Mandelbrot set and the Julia
set around the area
![]() .
.
Misiurewicz Points.
One special type of calculated value for
![]() is called the Misiurewicz point.
The Misiurewicz point is formed by an iterative path orbit with a periodic
orbit, whose initial starting point
is called the Misiurewicz point.
The Misiurewicz point is formed by an iterative path orbit with a periodic
orbit, whose initial starting point
![]() is not included in the orbit. These
paths also have a corresponding orbit in the Julia set.
is not included in the orbit. These
paths also have a corresponding orbit in the Julia set.

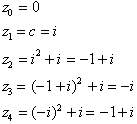
Figure
5.33 Calculated values for orbit paths of Misiurewicz points at
![]() and
and
![]() .
.
[Empty ?]

Figure 5.34 Orbit paths of Misiurewicz points at
![]() and
and
![]() .
.
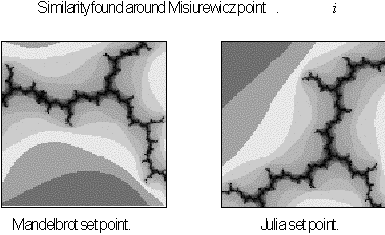
Figure 5.35 Similar structure of the Misiurewicz point in the Mandelbrot
set and the Julia set seen at
![]() .
.
As we have seen the Mandelbrot set is a map for all the corresponding Julia sets, let use MandelMovie to explore this feature.
 Exploring Julia Sets with MandelMovie
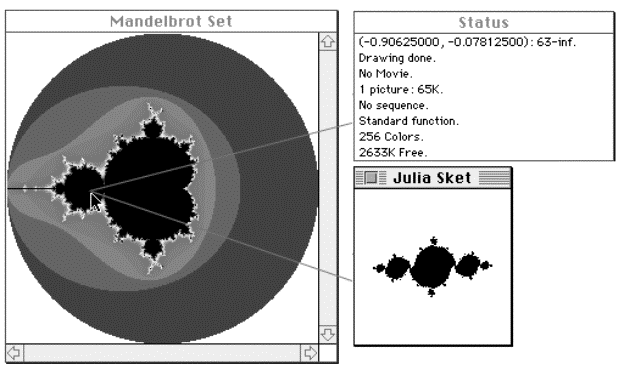
Figure 5.36 MandelMovie with Julia Set Sketch feature.
One feature of MandelMovie lets you immediately view an outline of the Mandelbrot's corresponding Julia set. To activate this feature select "Julia Set Sketch" [13] from MandelMovie's "Windows" menu.
 How
Julia Set Sketch Works.
The method used to generate the "Julia Set Sketch" outline is known as invariance. As we saw earlier in this section, if a point of iteration starts with a boundary value, the calculated iteration will also be on the boundary. This point in turn will generate another boundary point and so on and so on ... . This procedure provides a quick method to view a rough outline of the Julia set. It uses the same principles as the "chaos game" method discussed further in the IFS Algorithms section found in Chapter 7.
In a related method, random points can also be iterated to produce Julia sets. Often some regions receive a large number of points while other sections receive very few. A "weighted averaging" can be used to increase the probability that a point will reach a sparsely plotted region. This method is used to produce an even level distribution of detail in Julia sets [14] .

Figure 5.37 Two methods to create Julia sets with and without weighted averaging.
Exploring Details in Julia Sets
If you want to view a Julia set in greater detail, click the mouse on a point in the Mandelbrot set plane. MandelMovie will draw the corresponding Julia set. You can examine your Julia set at any scale, just as you did with the Mandelbrot set. Mandelbrot set boarders tend to have nice Julia set boundaries.
The following series of blowups of the Mandelbrot set should give you some indication of this:
Lets use MandelMovie to explore similar structures of corresponding Mandelbrot sets and Julia sets.
 Exploring
Similar Regions of Mandelbrot Sets and Julia Sets.
(top)
Similarity can be found in regions of the Mandelbrot set and its corresponding Julia set by following these easy steps:
Step 1: Find a small copy of the Mandelbrot set or any small contained region by continuously zooming in on a multi-spotted boarder region. The contained region chosen should be one that can not be seen initially from the overall Mandelbrot set and should only take up a small portion of the picture window. This will allow you to see the similar structural boundaries of the set.
Step 2: Click on a small contained region holding the shift key found in your created window. By holding down the shift key a copy of the "Mandelbrot Set" window will remain open as the new corresponding "Julia Set" window is drawn. This will let you visually compare the two sets side by side.
Step 3: Select "Coordinates" from the "Window" menu bar and place the same value for Re(z) as is found in Re(c) "box" and the same value for Im(z) as is found in Im(c) "box", you might also want to increase the amount if maximum iterations calculated for a finer resolution in its "box" also found here, this will depend on your level of magnification. Now press the "Save Coordinates" button. Finally continue to zoom in on the displayed center region of the Julia set until you get a similar pattern to that of the zoomed in region of the Mandelbrot set.
It should be noted that you will generally notice a rotation in the two set's patterns, and some times only certain regions will be similar, this is especially true if you have chosen a region on the outer fringes of the Mandelbrot set. Repeat this exercise with different regions and compare your results.
So
far we have only examined non-linear fractals produced with the iteration
function
![]() . Iterations of different non-linear functions can also show wonderful results
[15]
see Figure 5.40, Color Plates 39 -44 and Gallery of Non-linear
Fractals in Appendix I.
. Iterations of different non-linear functions can also show wonderful results
[15]
see Figure 5.40, Color Plates 39 -44 and Gallery of Non-linear
Fractals in Appendix I.

Figure 5.38 Non-linear fractals created with
![]() iteration functions.
iteration functions.
The Mandelbrot set has a way show up in the all sorts of places, even in
deferent iteration functions. Here it shows up in the magnification of the equation
![]() .
.
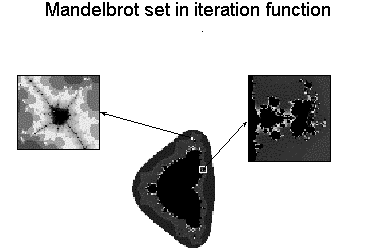
Figure 5.39 The Mandelbrot set showing up in the equation
![]() .
.
Other Features of MandelMovie
[16]
• You can cut and paste MandelMovie pictures to save in other programs as "pict." images.
• MandelMovie also provides movie-making facilities so that you can, for instance, zoom in smoothly on a point of interest, or watch how the Julia set changes as you follow a path in the Mandelbrot plane. Refer to the manual for more information.
 Other Methods Used to Calculate the Mandelbrot
Set
Here we have touched on a few ways to calculate Mandelbrot sets and Julia sets, usually the most straight forward and simplest approaches. There are many other methods used to calculate these non-linear fractals. They will just be briefly mentioned here.
• The disk method, also called the potential method, plots disks with a radius proportional to the distance of the set's boundary.
• The path method tries to complete a boundary path of equivalent escape values around the Mandelbrot set [17] .
• The greatest square method constructs continuously larger squares and fills them in with the same color until the color values of the corners are no longer equal.
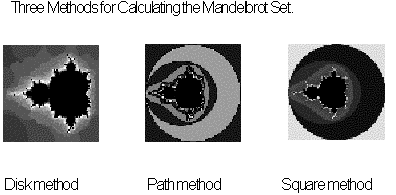
Figure 5.40 The Mandelbrot set Being Calculated By The Disk Method, The
Path Method and The Greatest Square Method
[18]
.
The
Mandelbrot set can be given a
![]() -dimensional look by plotting its height in accordance with the number of
iterations needed for its escape, with the contained Mandelbrot set being
its highest value see Figure 5.41
and Color Plates 45-46. In other projections the Mandelbrot set and Julia
sets can be plotted as connected segment slices for changing values of
-dimensional look by plotting its height in accordance with the number of
iterations needed for its escape, with the contained Mandelbrot set being
its highest value see Figure 5.41
and Color Plates 45-46. In other projections the Mandelbrot set and Julia
sets can be plotted as connected segment slices for changing values of
![]() and
and
![]() respectively see Color Plate 47-48.
respectively see Color Plate 47-48.
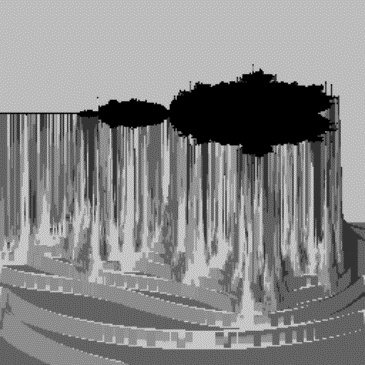
Figure
5.41 Mandelbrot set plotted with a
![]() -dimensional projection.
-dimensional projection.
The Recurrence of Mathematics
As seen earlier, mathematical patterns have a way of manifesting themselves in unexpected places. For example there is an interesting correlation between the Mandelbrot set and the logistic map found in chaos modeling. If both are plotted side by side you will find that the regions of periodicity found in orbits of the Mandelbrot set correlate closely to the bifurcation points of the logistic map. See Appendix C for information on the logistic map. Even the value of π has shown up in the Mandelbrot set [19] in relationship to calculations carried out in determining the width of the narrowest regions of the set.
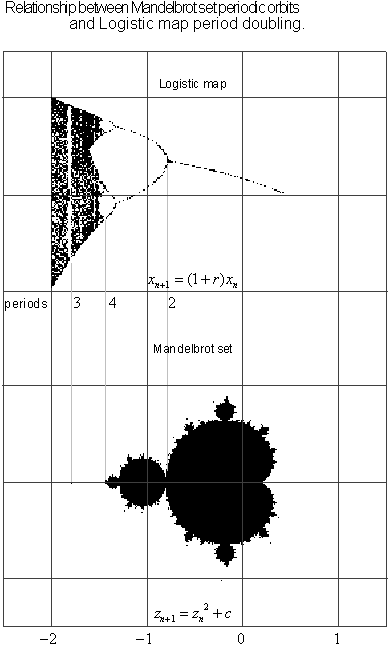
Figure 5.42 Logistic map in correlation
to the Mandelbrot set.
We tried to offer as much as we could with the programs [20] included here to explore the world of the Mandelbrot set and Julia sets. Venture out on your own, there is a infinite number of possible shapes to be found. Who knows there is a good change that you will find something that no one has seen before.

Figure 5.43 Just one of the endless possibilities you can find with MandelMovie™
[21]
.
[1] See Appendix F for Beniot Mandelbrot's personal account and Color Plate 26 of the "Modern Fractal Fathers", Richard Voss, Benoit Mandelbrot, Dietmar Saupe and Heinz-Otto Peitgen.
[2]
Presented to Benoit Mandelbrot on his 80th birthday.
Published MIT Press, 2004, for the entire speech from The Ghost from the
Grand Banks by Arthur C. Clarke.
[3] The Guinness Book of World Records (1990) Guinness Publishing page 73 asks " Most complex object in mathematics ?"
[4] This is a collage of old etchings and no such machine really exists.
[5]
Initially these numbers importance had no immediate
impact on mathematics; it was not until Raphael Bombelli (1560-1621) showed
their usefulness in solving real equations that their use began to gain
acceptance. In subsequent years René Descartes (1596-1650), in 1637, coined
the term imaginary, and set
![]() to describe negative square roots.
In 1837, William Hamilton (1805-1865) defined imaginary numbers algebraically,
in the form we use today
to describe negative square roots.
In 1837, William Hamilton (1805-1865) defined imaginary numbers algebraically,
in the form we use today
![]() .
.
[6] The Mandelbrot set is considered an uncomputable set because points on the boundary of the set often can not be determined if they belong in the set or escape to infinity. This uncertainty, demonstrated by Stephen Smale and Lenore Blum both of the University of California at Berkeley, demonstrates how computational mathematics is presenting new challenges to the field. In contrast the Mandelbrot set generated using computational methods raised the question "What is its dimension ?" which was solved classically and found to be 2.
[7] In calculating the Mandelbrot set on a computer, you iterate each point a certain number of times (perhaps 100) to see if it escapes. You don't carry this procedure out indefinitely, because a computer will typically have to calculate well over a hundred thousand individual pixel points. A high number of iterations lowers the computers efficiency but produces higher resolution. If the point has not escaped by then, we plot it as contained, even though in rare instances, there might be a slight chance that a border point might have been missed.
[8] Created using MandelMovie's obit feature,
[9] [9] From Über die Iteration rationaler Funktionen, Jahresberichte der Deutschen Mathematischen Vereinigung 33 (1925) pages 185-210.
[10] Julia was inspired by the one page letter by the British Mathematician Sir Arthur Cayley, published Newton- Fourier imaginary problem, American Journal of Mathematics 2, 1879 roots of z^3 - 1 = 0 method pendulum
[11] Gaston Julia, Memoire sur l'iteration des fonctions rationalles, Journal de Mathematics Pure et Appl. 8 (1918) 47-245
[12]
![]() as
as
![]() escape to infinity,
escape to infinity,
![]() as
as
![]() and
and
![]() as
as
![]() are contained in Julia set.
are contained in Julia set.
[13]
The invariant out line of the Julia set is calculated
for the sake of equality z is replaced by w and is written
![]() .
.
[14] In depth detail on weighted averaging see Beauty of Fractals (1986) Heinz-Otto Peitgen, Peter H. Richter and Dietmar Saupe. Pages 35-45 Springer Varlag Berlin.
[15] Generation of equated fractals is possible with MandelMove™ 1.8 or greater.
[16] An expanded version of MandelMovie can be ordered from Dynamic Software, see order form in on disk.
[17] Calculation of Mandelbrot sets can be slow so there is a need for more speed. Sometimes new ideas have a way of spawning other new ideas. In a discussion with Heinz-OttoPeitgen in 1986, he reveled to me that Dietmar Saupe and him along with a few others had developed a faster way to calculate Mandelbrot sets. Since it would soon be publish I would have to wait until then to see the results. I thought about what it could be and then came to the conclusion it had to be some kind of path method that could make its way around the contours of the Mandelbrot set. Their were slight complications in the way it would handle compact regions with similar values, but on the whole I was certain those regions could be calculated using refinement in measurement and by telling the computer what to look for in a path solution. I am sure there were others working on similar methods. When Peitgen's solution was published it turned out to be the altogether different potential disk method.
[18] The Disk Method is in discussed in The Science of Fractal Images by Heinz-Otto Peitgen and Dietmar Saupe, pages 289-293.
[19]
As is often the case in mathematics certain values
or constants show up in unexpected places. In 1991, Dave Boll was trying
to calculate the thickness of a connecting strand at
![]() . Using continually smaller boundary values of
. Using continually smaller boundary values of
![]() , he noticed that the number of iterations needed for point
, he noticed that the number of iterations needed for point
![]() to escape correlated in such a
way that as the limit
to escape correlated in such a
way that as the limit
![]() , (the number of iteration)
, (the number of iteration)
![]() . Posted D. Boll, Pi and the Mandelbrot set(again) on the mathematics
newsgroup of the electronic bulletin USENET article <1992Feb26.222630.36612@yuma.acns.colostate.edu>.
. Posted D. Boll, Pi and the Mandelbrot set(again) on the mathematics
newsgroup of the electronic bulletin USENET article <1992Feb26.222630.36612@yuma.acns.colostate.edu>.
[20] Warning label that not all features of MandelMovie are contain in the software versions found in this book. If you want to explore further you can write Dynamic Software P.O. Box 13991 Berkeley, CA 94701 for ordering information.
[21] Iteration cutoff level was set at 2000 and integer accuracy was set to 15.
